

Documentation Index

Fetch the complete documentation index at: https://docs.oleria.com/llms.txt

Use this file to discover all available pages before exploring further.

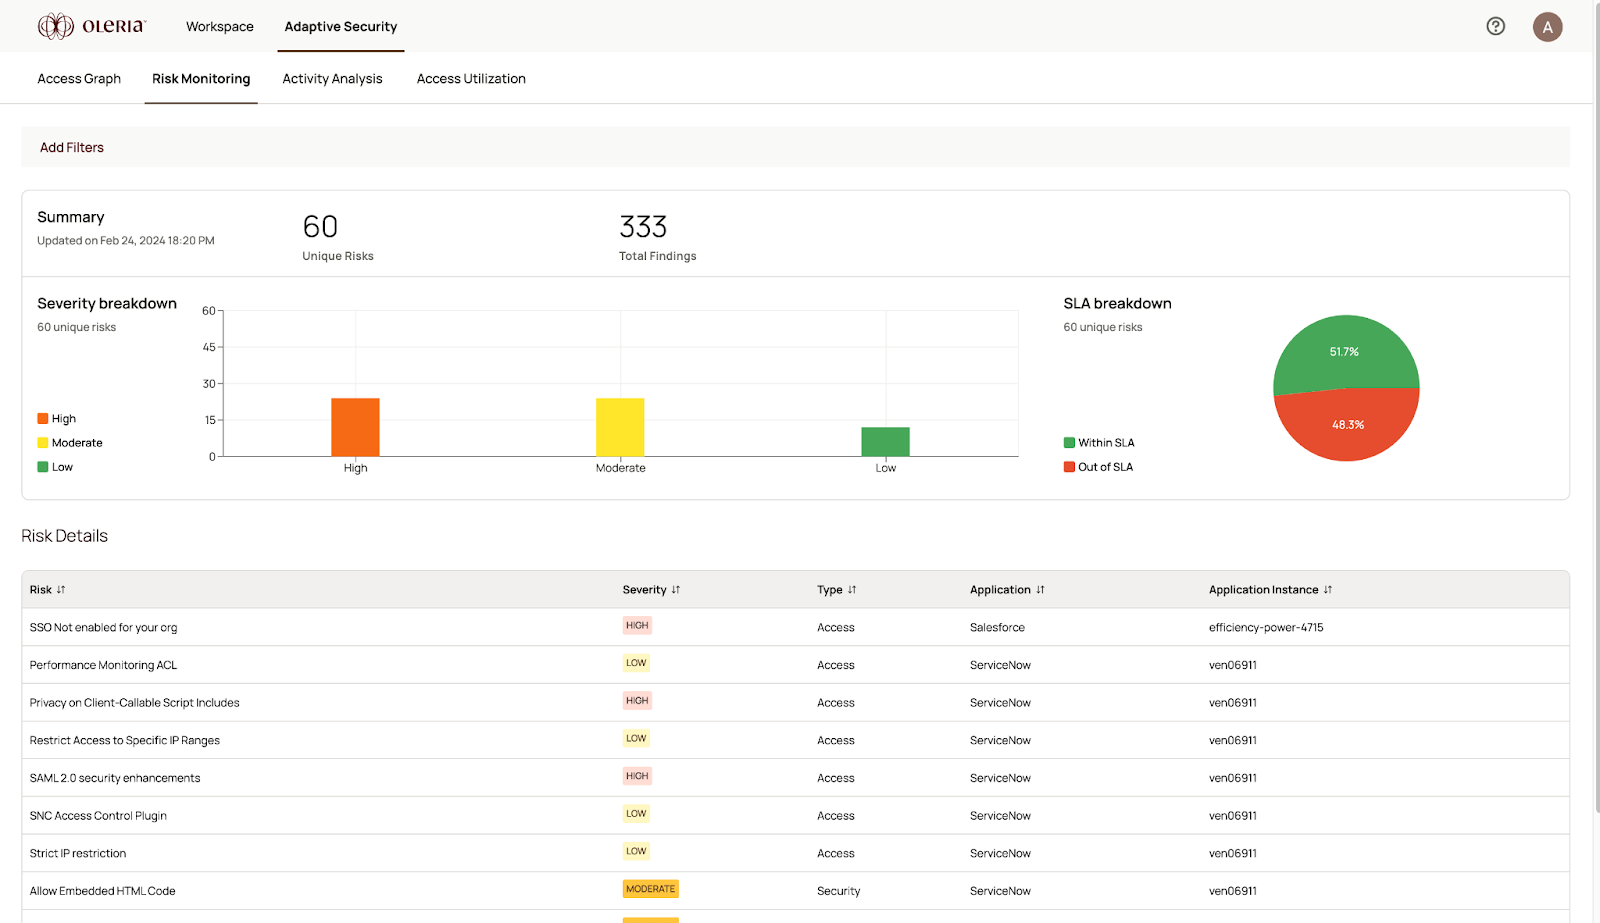
The Risk Monitoring chart gives you a live snapshot of your open risk posture across all connected applications - how many distinct risk types exist, how many individual findings are open, and how they distribute across severity levels. Use it to track whether your posture is improving over time and identify where to focus remediation effort. Risk monitoring chart showing unique risks, total findings, and severity distribution

Summary metrics

The header surfaces three key values at a glance:
MetricDescription
Unique risksThe count of distinct risk types currently identified across your applications.
Total findingsThe sum of all individual events across every unique risk.
SeverityThe distribution of open findings by severity level: critical, high, medium, and low.

How to read the chart

The chart plots total open findings over time. A declining trend indicates active remediation is closing risks faster than new ones are being detected. A rising trend means new risks are accumulating faster than they are being resolved - a signal to increase remediation cadence. The severity breakdown is as important as the total count. A growing share of critical and high findings relative to medium and low means your highest-priority risks are accumulating. Address those first.

SLA tracking

Each risk in Oleria is tracked against a resolution SLA. The dashboard surfaces risks that are approaching or past their SLA deadline, letting you prioritize based on urgency rather than discovery date alone. Risks breaching their SLA represent your most time-sensitive remediation work.

Risk table

Below the chart, a table lists every open risk across your connected applications. Each row surfaces the key details needed to assess priority:
  • Risk - the name and description of the identified risk
  • Severity - critical, high, medium, or low
  • Application - the application where the risk was detected
  • Findings - the number of individual events for that risk type
  • Age - how long the risk has been open
Select any row to open the risk detail fields side panel for the full context on that risk and its recommended remediation action.

Filtering and export

Use the filter bar above the table to narrow by application, application instance, risk type, or severity. To work through risks for a single application, apply the application filter first. See View and filter risks for step-by-step filter instructions. You can also export the table as a CSV for reporting or offline analysis.

Contact us

For questions, contact us at support@oleria.com.