
Documentation Index

Fetch the complete documentation index at: https://docs.oleria.com/llms.txt

Use this file to discover all available pages before exploring further.

The Access Graph is a visual map of how accounts connect to applications, groups, roles, and resource instances. This page explains how to read the graph - nodes, edges, node details, and the activity overlay - so you can navigate access relationships with confidence.

Nodes and edges

Each data entity in the graph is a node. Nodes are styled by entity type to make them visually distinct. Connections between nodes are edges that represent how access flows from one entity to another.

Nodes

Node typeDescription
IdentityYour organization’s unique user profile, based on an email alias. An identity can have accounts across multiple applications.
Application accountA user account within a specific application - for example, an Anthony Lee account in Salesforce Production.
GroupA collection of application accounts that share access permissions within an application.
RoleA set of permissions within an application that can be assigned directly to accounts or to groups.
ResourceA category of data entity within an application - for example, a Salesforce object type or a Google Drive folder type.
Resource instanceA specific instance of a resource - for example, a specific Salesforce record or a specific Google Drive folder.

Edges

Edges represent the access relationships between nodes. The direction of an edge shows how access is granted - for example, an edge from a Role node to a Resource Instance node means that role grants access to that resource instance. Edge thickness reflects access frequency when the activity overlay is enabled: thick edges indicate high usage, thin edges indicate low usage, and dotted edges indicate zero usage.

Node details

Selecting a node opens a side panel with details about that entity - its context, permissions, and connections. Example: Select the node for Anthony Lee to open a side panel showing his email, user ID, role, user groups, and permissions. In this example, Anthony has a seed admin role, belongs to the engineering, board, sales, HR, and IT support groups, and has permission to access eight resource instances. Access Graph user details panel for Anthony Lee

Activity overlay

The activity overlay shows how frequently each account uses the access it has, rendered directly on the graph as edge thickness.
Line styleMeaning
Thick lineHigh access frequency
Thin lineLow access frequency
Dotted lineZero access
This lets you immediately identify unused access and decide what to revoke. Example: Anthony Lee, Mary Johnson, and Oleria Connector all have access to the Comic Movies file. Anthony accesses it frequently (thick line), Mary accesses it occasionally (thin line), and Oleria Connector has never accessed it (dotted line). Because the Oleria Connector has zero activity, the admin can remove that access. Activity overlay showing thick, thin, and dotted access paths for three accounts on the Comic Movies file The Access Graph search lets you find identities, application accounts, resource instances, groups, or roles. You can use an account name or email address to search.
If you are searching for an email address that contains reserved characters, wrap it in quotation marks. Example: "demo-salesforce-group+anthonylee@oleria.com"
Access Graph search interface

Search application accounts

Enter the name or email address of an application account in the search bar and select the account from the results. The graph displays a separate node for each application instance where that account exists. Example: Anthony Lee has accounts in Salesforce Production, Salesforce Dev, ServiceNow, Microsoft M365 SharePoint, and Google Drive. The graph shows a separate account node for each. Access Graph search results for Anthony Lee showing separate nodes for each application

Search resource instances

Enter the resource instance name in the search bar and select it from the results. The graph displays a separate node for each application and environment where that resource instance exists. Example: If you have integrated Google and Salesforce, and the resource instance exists in both, you see two nodes - one per application. If you integrated Salesforce Production and Dev instances, you see two more nodes - one per environment. Access Graph search results for a resource instance showing separate nodes per application and environment Access Graph updates in real time as you interact. You can trace paths from an account to the resource instances it can reach, or from a resource instance back to every account, role, and group with access.
1

Search for the account

Enter the identity or application account name or email in the search bar. The graph displays all matching identity or application account nodes.
2

Select the account node

Select the account node to open its side panel. The panel shows email, user ID, assigned roles, group memberships, and resource access.
3

Add a resource to the graph

Select any resource from the side panel. The graph builds out to include that resource node.
4

Select the resource node

Select the resource node to open a side panel listing the resource instances accessible to that account.
5

Add resource instances to the graph

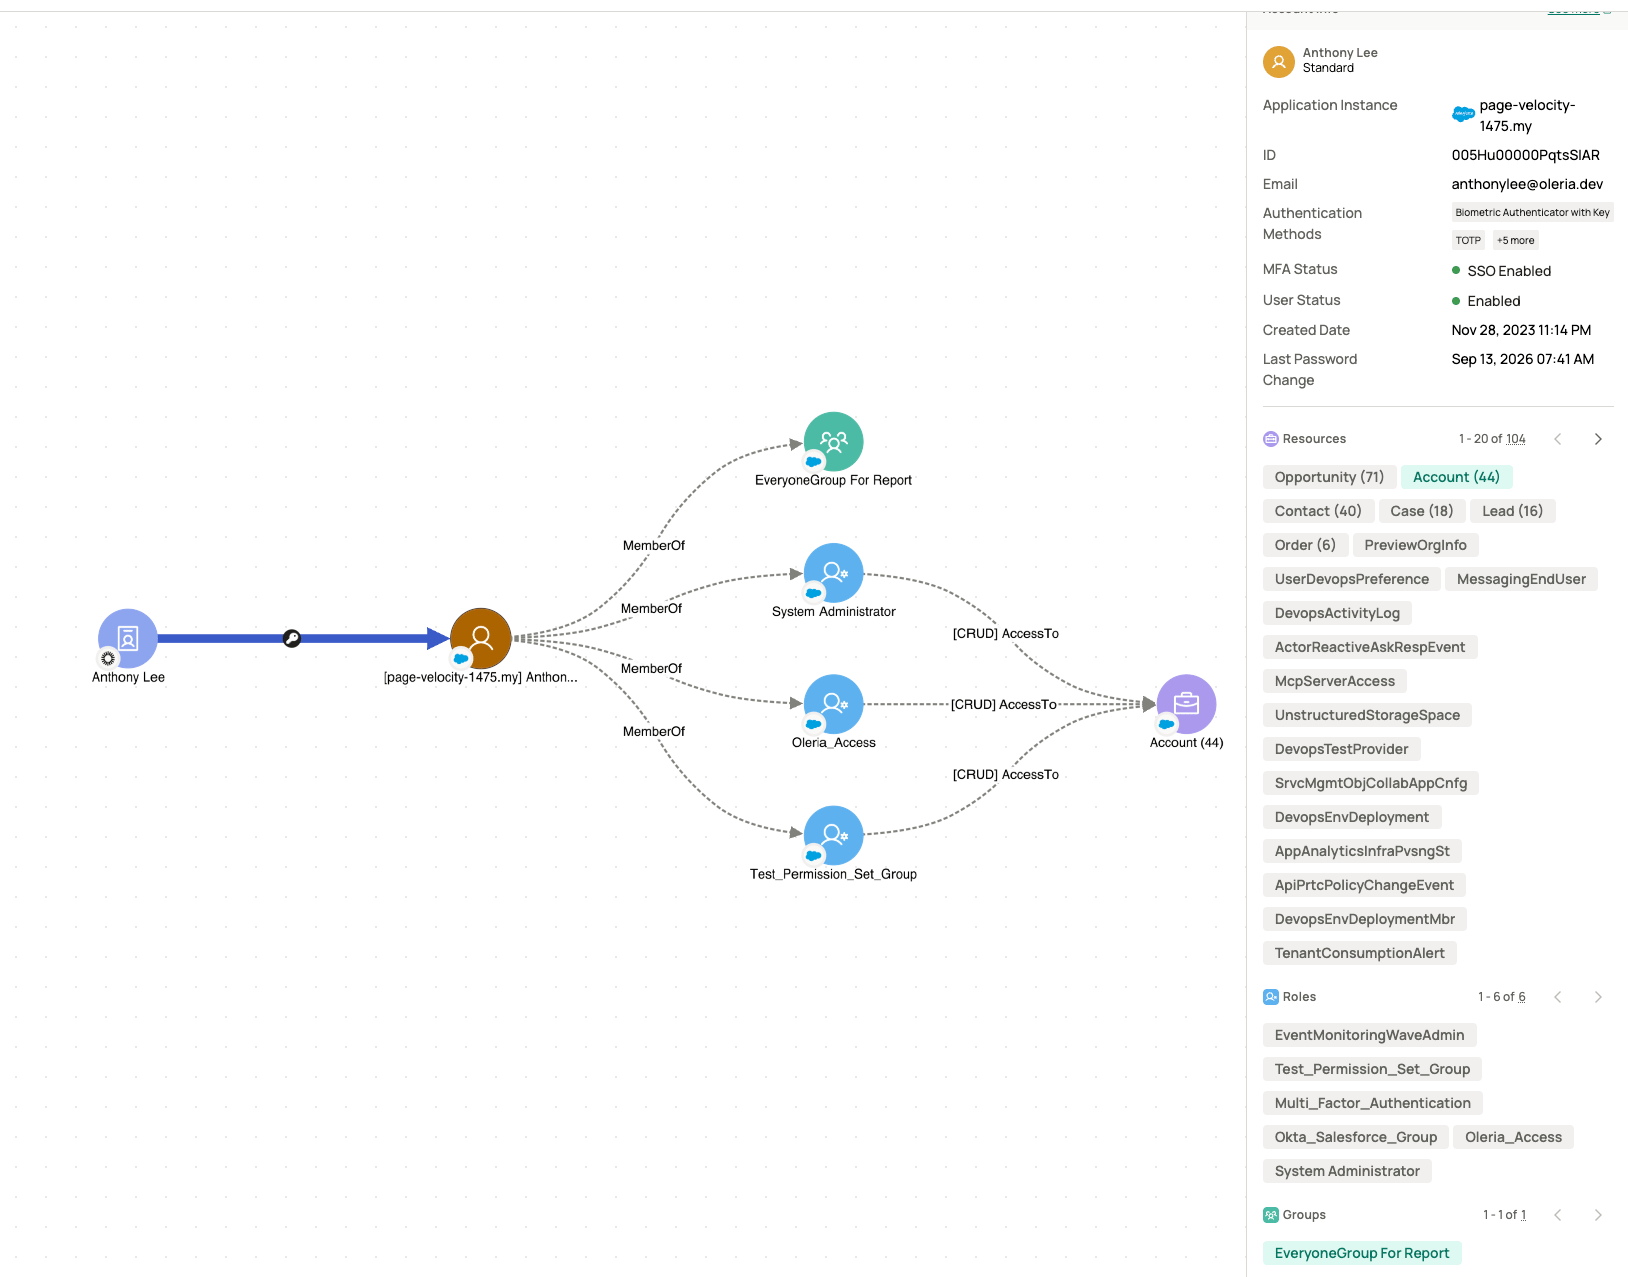
Select one or more resource instances. The Access Graph for the account you searched displays.Access Graph showing Anthony Lee's access path to Salesforce, System Administrator role and group, and Account resource instances
1

Search for the resource instance

Enter the resource instance name in the search bar. The graph displays all matching resource instance nodes across your applications.
2

Select the resource instance node

Select the resource instance node to open its side panel, which shows:
  • Resource instance - the name of the resource instance
  • Resource - the resource this instance belongs to
  • Roles - roles that can access this resource instance
  • Groups - groups that can access this resource instance
  • Application accounts - accounts that have direct access
3

Add roles or accounts to the graph

Select any role or application account from the side panel to build the graph.
4

Complete the graph

Select one or more roles or resource instances to finish building the graph. The full Access Graph for the resource instance displays.Access Graph showing multiple roles, groups, and accounts that can access the Board Deck resource instance

Contact us

For questions, contact us at support@oleria.com.